
PTE Describe Image Practice sample – Look at the Line graph image below. You will have 40 seconds to give your response. You should describe the image in a logical manner. Basic Strategy to describe the image– Start with an introduction, followed by the main body, and end with a conclusion.
Related Links-
PTE Speaking- Describe Image With Answer 6 (Pie chart)
PTE Speaking Practice 5- Describe Image (Process) With Answer
#1 Describe the image (Line graph) given below-
The graph shows the change in the age of marriage for men and women from the year 1900 to 2000.
The average age of women and men has increased from the year 1900 to 2000. In 1900, the average age of women for marriage was considered to be 22 years as compared to 26 years of men. The average age for marriage has shown a decline during 1 or 2 decades. In mid-1960’s, the minimum age of men was around 23 years while women age was 20 years old. With the change in time, the age gap difference between women and men has fallen from 5-6 years to 1 or less. In 2000, the average age for marriage was between 26 to 27 for men and 24-25 for women.
#2 Describe the image (Line graph) given below-
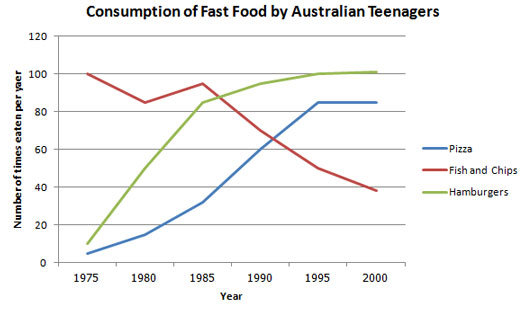
The line graph illustrates the consumption of fast food by Australian teenagers from the year 1975 to 2000.
The rate of consumption of fast food has increased from years. During 1975, the consumption of fish and chips was highest as compared to other fast food like pizza and hamburgers. In coming next years, the number of pizza and hamburgers has risen where as fish and chips has shown the drop in consumption. Pizza and hamburgers have shown growth of 5 times to around 82 times and 4 to almost 100 times respectively from 1975 to 2000. On the other hand, fish and chips have seen the downward slope in 25 years.