
PTE Speaking (section) Describe Image Practice material – Look at the Pie Chart image below. You will have 40 seconds to give your response. You should describe the image in logically structured. Strategy to describe the image– Start with an introduction, followed by the main body, and end with a conclusion.
RELATED LINKS-
PTE Speaking Practice 5- Describe Image (Process) With Answer
PTE Academic Speaking Practice 4- Describe Image (Bar) With Answer
This type of question speaking requires speaking skills, test takers to describe an image from given an academic source.
#1 Describe the image (Pie Chart) given below-
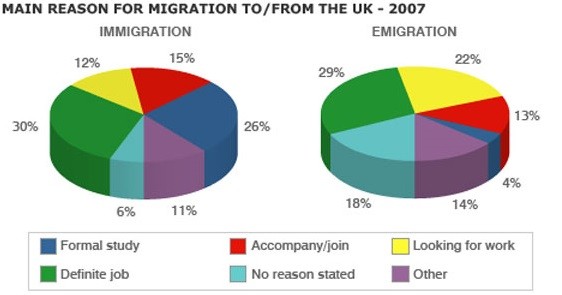
The pie charts illustrate the reason why people migrate to or from the UK in the year 2007.
At first, it is clearly stated that main reason of immigration or emigration of people to/ from the UK is employment. Around 30% of people have immigrated to the UK for a definite job where as 29% of people emigrate from the country. At second, 26% people immigrate to the UK for having a formal education while 4% of people stay in the country only. The 22% of people emigrate from the country in search of work where 12% of people come to the UK in the search. A significant number of people immigrate and emigrate to/ from the UK to join their families.
#2 Describe the image (Pie Chart) given below-
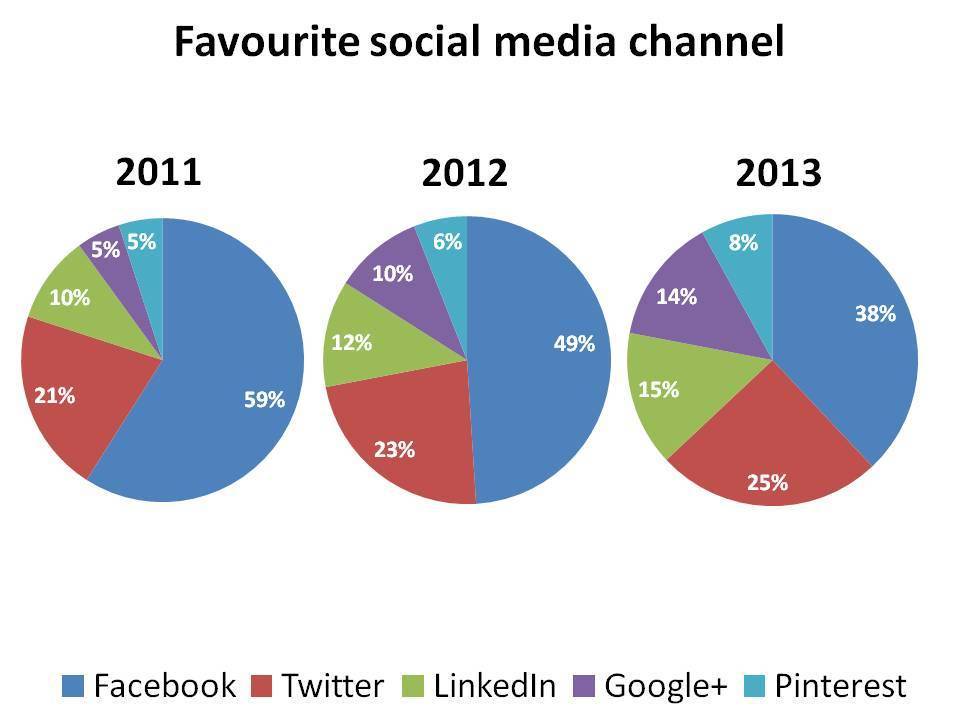
The pie chart illustrates the favorite social media used by people from the year 2011 to 2013.
The 3 pie chart shows the percentage number of people using social media as their favorite for entertainment. It’s evident that Facebook is the most favorite social media used but its fame has been on the decline over years. On the other hand, social media like Twitter and LinkedIn have shown the upward trend from the year 2011 to 2013. Still, the least used social media is recorded as Google+ and Pinterest.