
PTE Speaking Describe Image practice study material – Look at the BAR below. You will have 40 seconds to give your response.
This is a long-answer item type that assesses speaking skills and requires test takers to describe an image from given an academic source.
#1 Describe the image given below in 40 seconds-
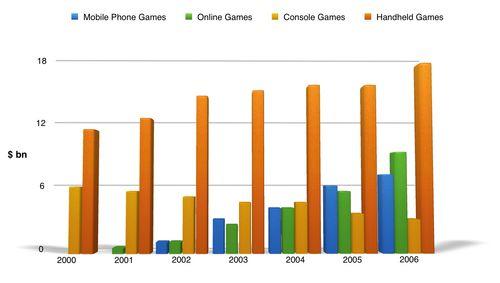
The bar graph shows the sale ( in billion dollars) of different types of digital games between the year 2000 and 2006.
It’s clear from year 200o to 2006, the highest amount of money was spent on Handled games as compared to others. It is also apparent through the year sale of console games has flattened while mobile phone games and online games have shown hike awfully.
#2 Describe the image given below in 40 seconds-
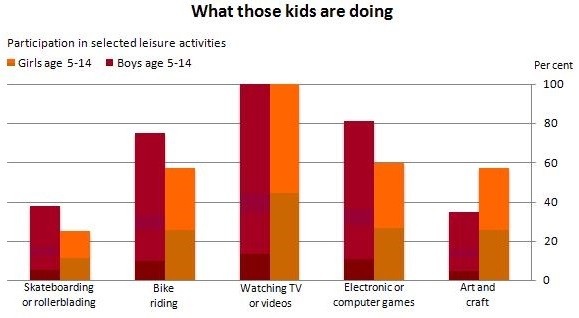
The given bar graph illustrates the participation of boys and girls of 5 to 14 years of the age group in selected leisure activities.
The most of the kids of age 5 to 14 years prefer to watch TV and online videos rather than any other activity. Around 80% of boys love to play electronic and computer games where girls show the least preference to it. Activity like bike riding is also one of the popular activity in boys and girls. On the other hand, the skateboarding and rollerblading are least popular among boy and kids. While art and craft are gaining popularity among girls rather than boys.
More Related Links-
Describe Image With Answer (Pie chart)- PTE Speaking Practice Sample 3
PTE Academic Speaking- Describe Image Bar Graph With Sample Answer