PTE Academic Speaking Describe Image Practice material – Look at the Bar Graph below. You will have 40 seconds to give your response. You should describe the image in simply and logically structured. Strategy to describe the image– Start with an introduction, followed by the main body, and end with a conclusion.
This types of questions require speaking skills to describe an image from given an academic source.
#1 Describe the image given below-
Sample Answer-
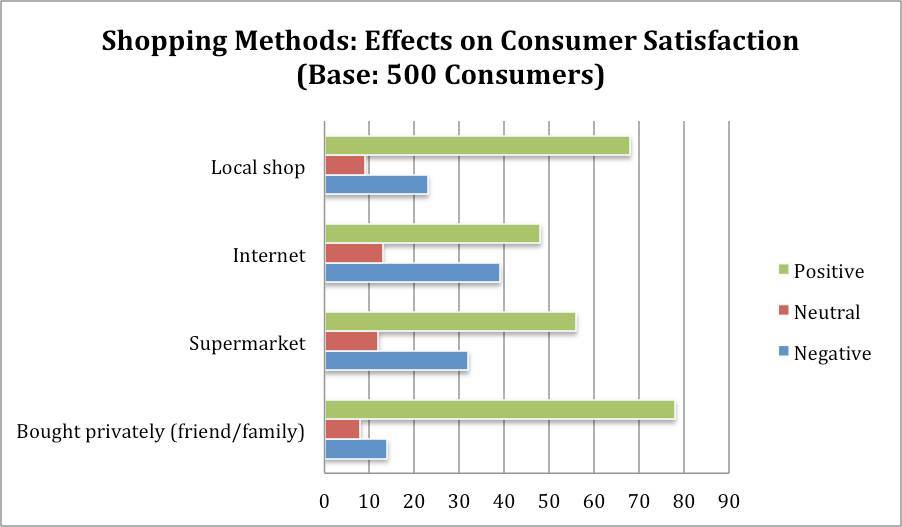
The bar graphs depict the diverse shopping methods which effect the satisfaction of consumers.
The audit of a survey done on 500 consumers helps to illustrate the various shopping methods used by them. The various shopping methods include a local shop, the internet, supermarket and private shopping with family or friend. As per the report, the private shopping methods has the positively highest percentage of consumers among other methods. Where as the percentage of negative consumers comes from internet shopping. The percentage of neutral consumers remains same in all shopping methods.
#2 Describe the image given below-
Sample Answer-
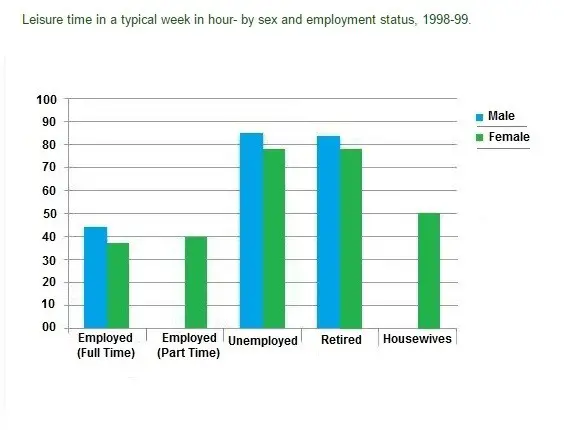
The bar graph compares the amount of leisure time enjoyed by male and female of different employment status.
Both male and female who are either unemployed or retired from their work enjoy more leisure time which is approx to 80 -85 hr per week. The data of male who works as part time or who stays at home as house staying men’s are not provided. On other hand men who are employed as full time enjoy around 45 hr in a week as compared to women who only get 35 hr in a week.
To conclude, unemployed and retired people get more leisure time as compared to others who are employed.