
PTE Academic Speaking Describe Image practice Exercise – Look at the graph below. In 25 seconds, please speak into the microphone and describe in detail what the graph is showing. You will have 40 seconds to give your response.
This is a long-answer item type that assesses speaking skills and requires test takers to describe an image from given an academic source such as a graph, map, chart, table or picture.
#1 Describe the image given below-
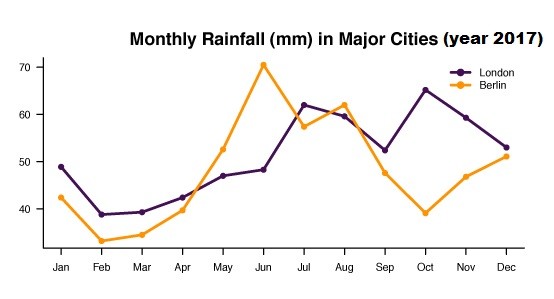
The line graph depicts the monthly rainfall in major European cities – London and Berlin in the year 2017.
In January, Berlin has recorded 42 mm rainfall as compared to London’s 50 mm. Coming to next month, Berlin and London have recorded dip in rainfall. The Month of June has shown highest rainfall for Berlin which has been marked to 70 mm. While London reached to peak in the month of October recording 65 mm where Berlin has shown low to 40mm.
To conclude, Berlin has recorded its highest rainfall in the month of June as compared to London’s in the month of October.
#2 Describe the image given below-
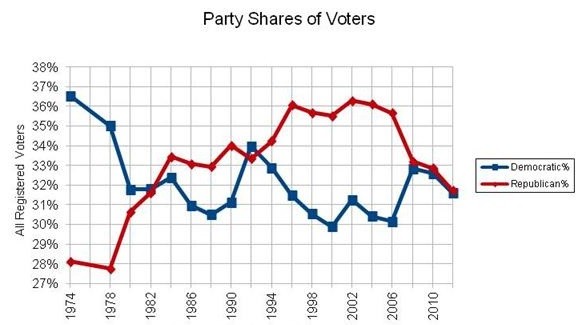
The line graph shows the percentage number of registered voters of the Democratic and Republican party from the year 1974 to 2010.
During the year 1974, the Republican party has recorded 28% of total registered voters as compared to Democratic party’s 36.5% voters. Both Democratic and Republican party has shown a decline in the year 1978. But the Republican party has started showing growth from the year 1980 where the Democratic party is on the decline. Coming to the year 2010, Democratic and Republican parties have shown the same number of registered voters.
In conclusion, the growth period of Republican party started after the year 1978. While Democratic showed the continuous decline in its registered voters after the year 1974.