
PTE Academic Describe Image Practice Sample– You will have 40 seconds to give your response. Describe the image in a logical manner.
Strategy to describe the image given below–
-Start with an introduction, followed by the main body, and end with a conclusion.
More Describe Image Practice Samples-
Describe Image Practice with Sample Answer 9 (Pie chart)
Describe Image Line Graph With Answer 2
#1 Describe the image (Pie Chart) given below-

The pie chart illustrates the most preferred mode of commuting by people in the region.
The total 0f 42% of the population prefers to travel or commute by metro. While the second most used mode of commuting is by own bikes with around 24 percent of total population. The 23% of population travel to their preferred locations by local buses. People who commute with cars have the least number of preference.
Thus, it’s clear the fastest and preferred mode of commuting is by metro.
#2 Describe the image (Pie Chart) given below-
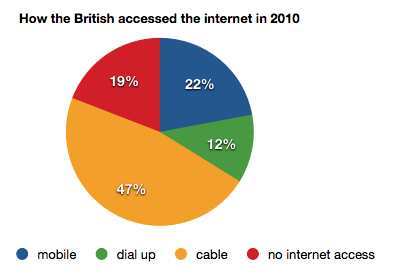
The pie chart shows how British people access the internet during the year 2010.
A large proportion of 47 percent of British people accesses the internet through cable network (broadband) in the year 2010. While 22% of Britishers access the internet through mobile marked to be second highest. Whereas 12 percent uses old way for accessing the internet that is dial-up. Almost 19 percent of people still have no internet access.
To conclude, people prefer to access the internet with help of cable lines.