
PTE Academic Speaking Describe Image practice Material – Look at the graph below. In 25 seconds, please speak into the microphone and describe in detail what the graph is showing. You will have 40 seconds to give your response.
This is a long-answer item type that assesses speaking skills and requires test takers to describe an image from given in Graph ( Bar Diagram ).
#1 Describe the image given below-
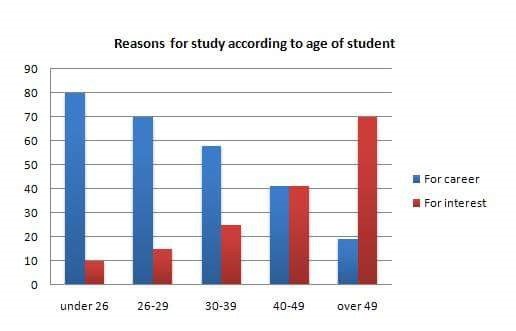
The bar graph depicts the reason for study by students on the scale of career and interest.
The 80% of students who are under age of 26 studies only to make their career while 10% have interest. As age gap exceeds to 29 from 26, percentage number of students who study for career decreases to 70 while students with some interest increase to 15 percent. At par age of 4o to 49, the equilibrium of study and interest arises between students. After the age of 49, students who study shows their interest.
In conclusion, bar graph describes students of age 26 study for their career while over 49 years of age studies for interest.
#2 Describe the image given below-
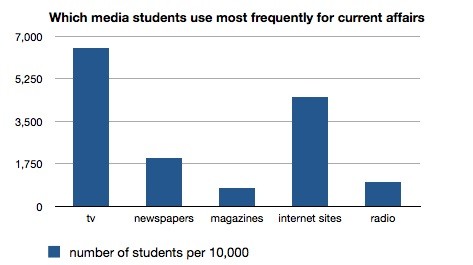
The bar graph shows the mode of media used by students to grasp about current affairs.
The students use different types of media to have knowledge on current Affairs. Almost over 7000 students out of 10000 watches TV to have news about current affairs. After TV, most used media for the current affair by students is the help of internet sites. The use of radio and magazines has been low due to others modes of media.
To conclude, mode of TV and internet sites is most affected media used by students nowadays.